Case 05 · 2021
60 analysts, one visual language
A data visualization system for Verdad Única, GHT Corp's reporting platform
Client: GHT Corp (Growers Hub Trading), where I worked as UX/UI Design Analyst
- UX
- UI
- Research
- Business challenge
- Verdad Única holds logistics, operations, commercial and financial data, but every analyst built reports in their own style, with chart types that did not always fit the data. Reports were slow to build and hard to read.
- My contribution
- As UX/UI Design Analyst, I facilitated research with users from every business area at the annual Analytics event. I turned the agreements into a reporting design system that works directly inside Power BI.
- Key result
- Built with 60+ analysts invited (attendance list of the Analytics event), it cut the time to build a report by 20% on average (surveys, validated against report volume), and 250+ users now read reports in one format (Digital Operations area).
Business challenge
GHT Corp is a fresh-cut flowers supply chain company. Verdad Única is its reporting platform, with large amounts of data from logistics, operations, commercial, financial and other areas.
The company needed to validate the platform’s experience with users and business analysts, to plan the next year’s improvements. The plan covered the report design system and critical flows. This case focuses on the report design system.
Research found many different styles and structures across reports, and chart types that were not always right for the data. Reports were slow to build and hard to read.
Role and contribution
I was the UX/UI Design Analyst on the project.
UX
I planned and facilitated the UX activities at the annual Analytics event. I turned the findings into layout rules: a clearly defined filter area, and single or multi-chart structures.
UI
I defined the system:
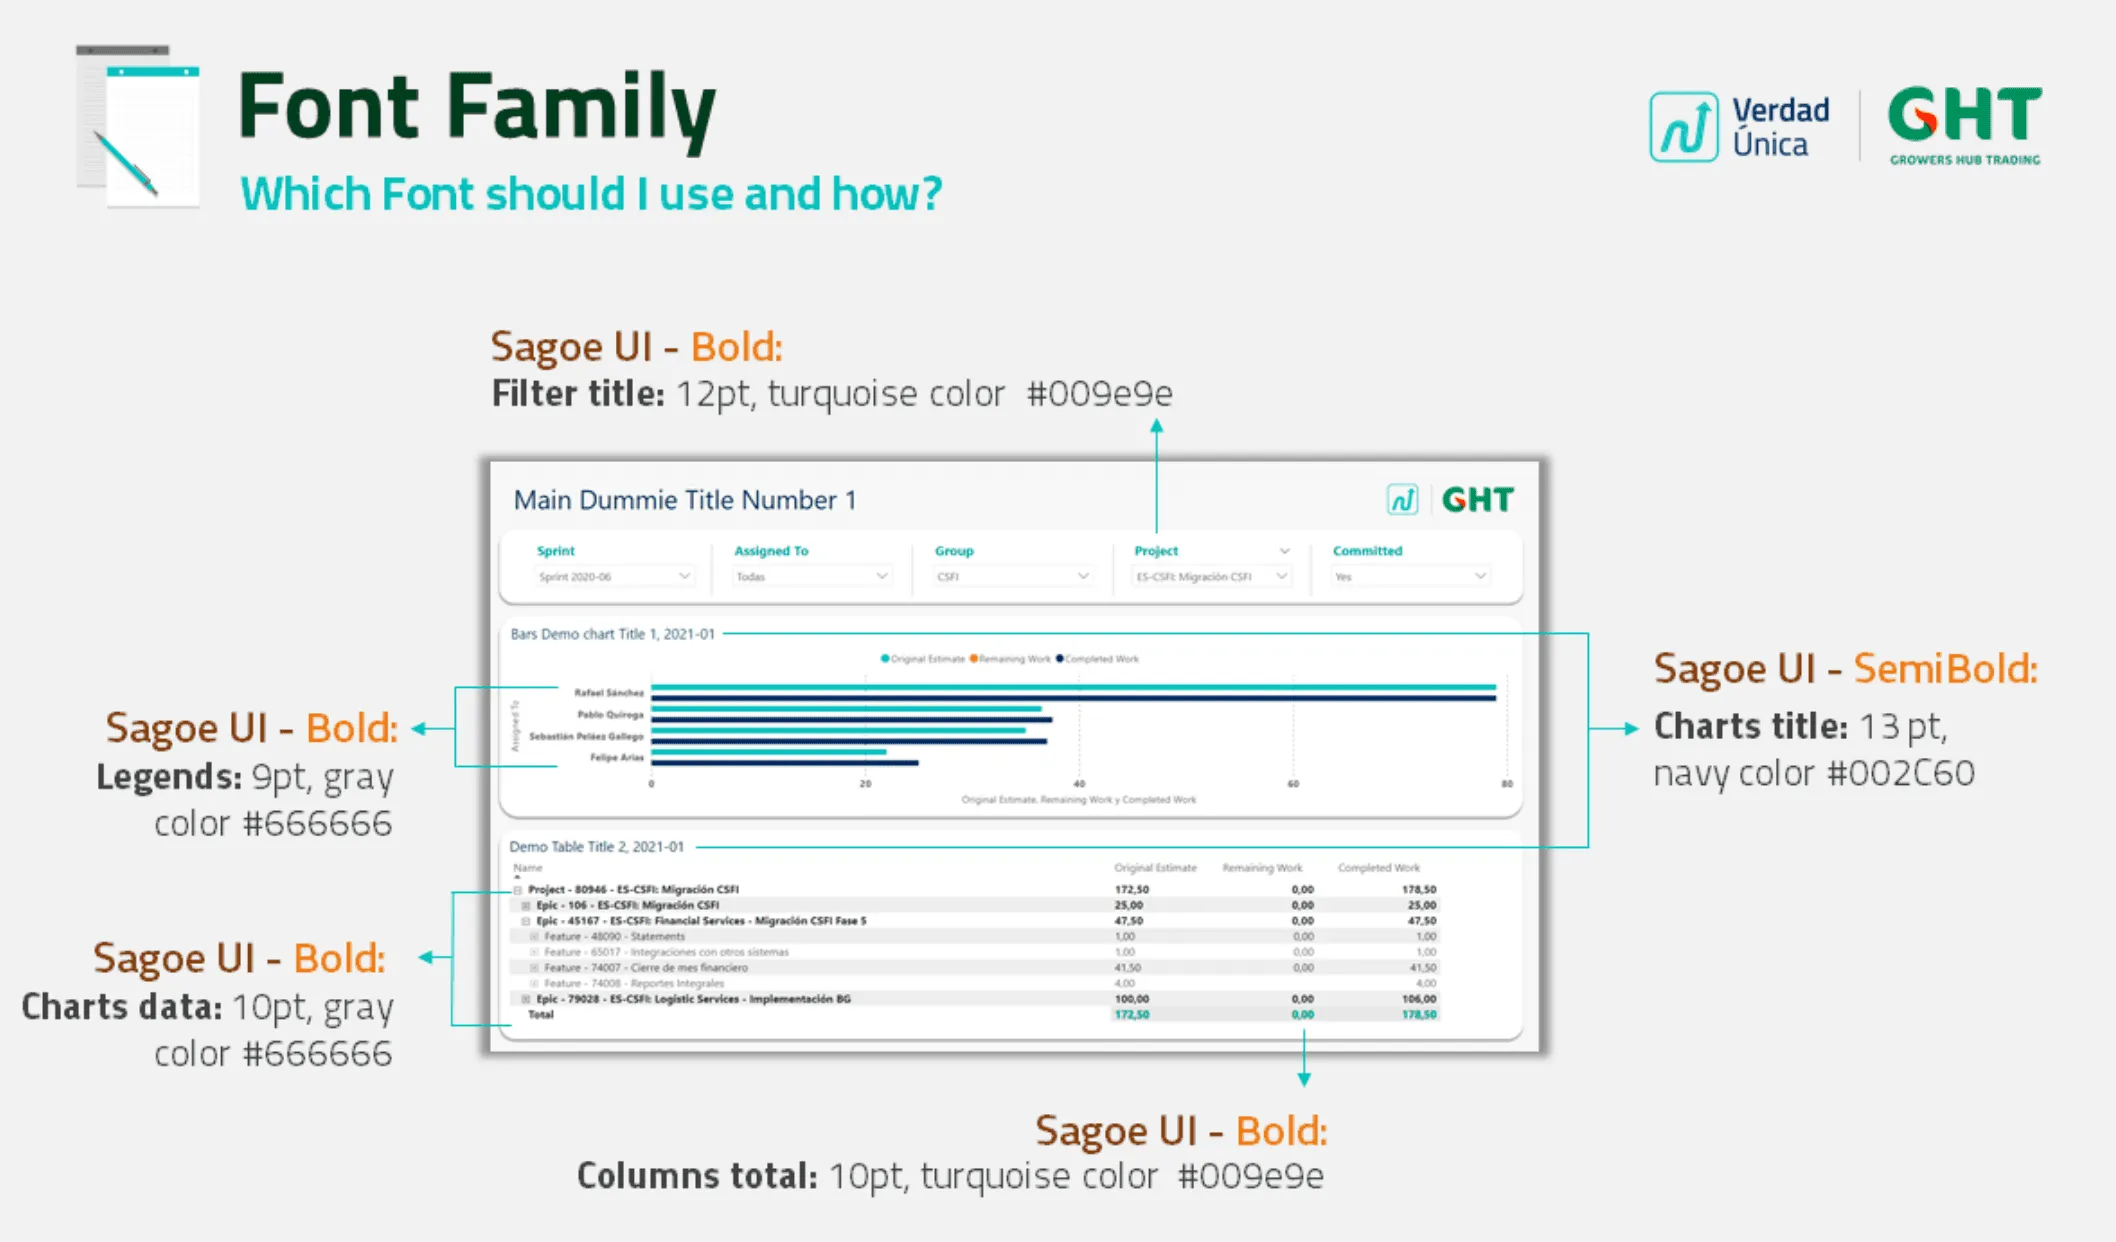
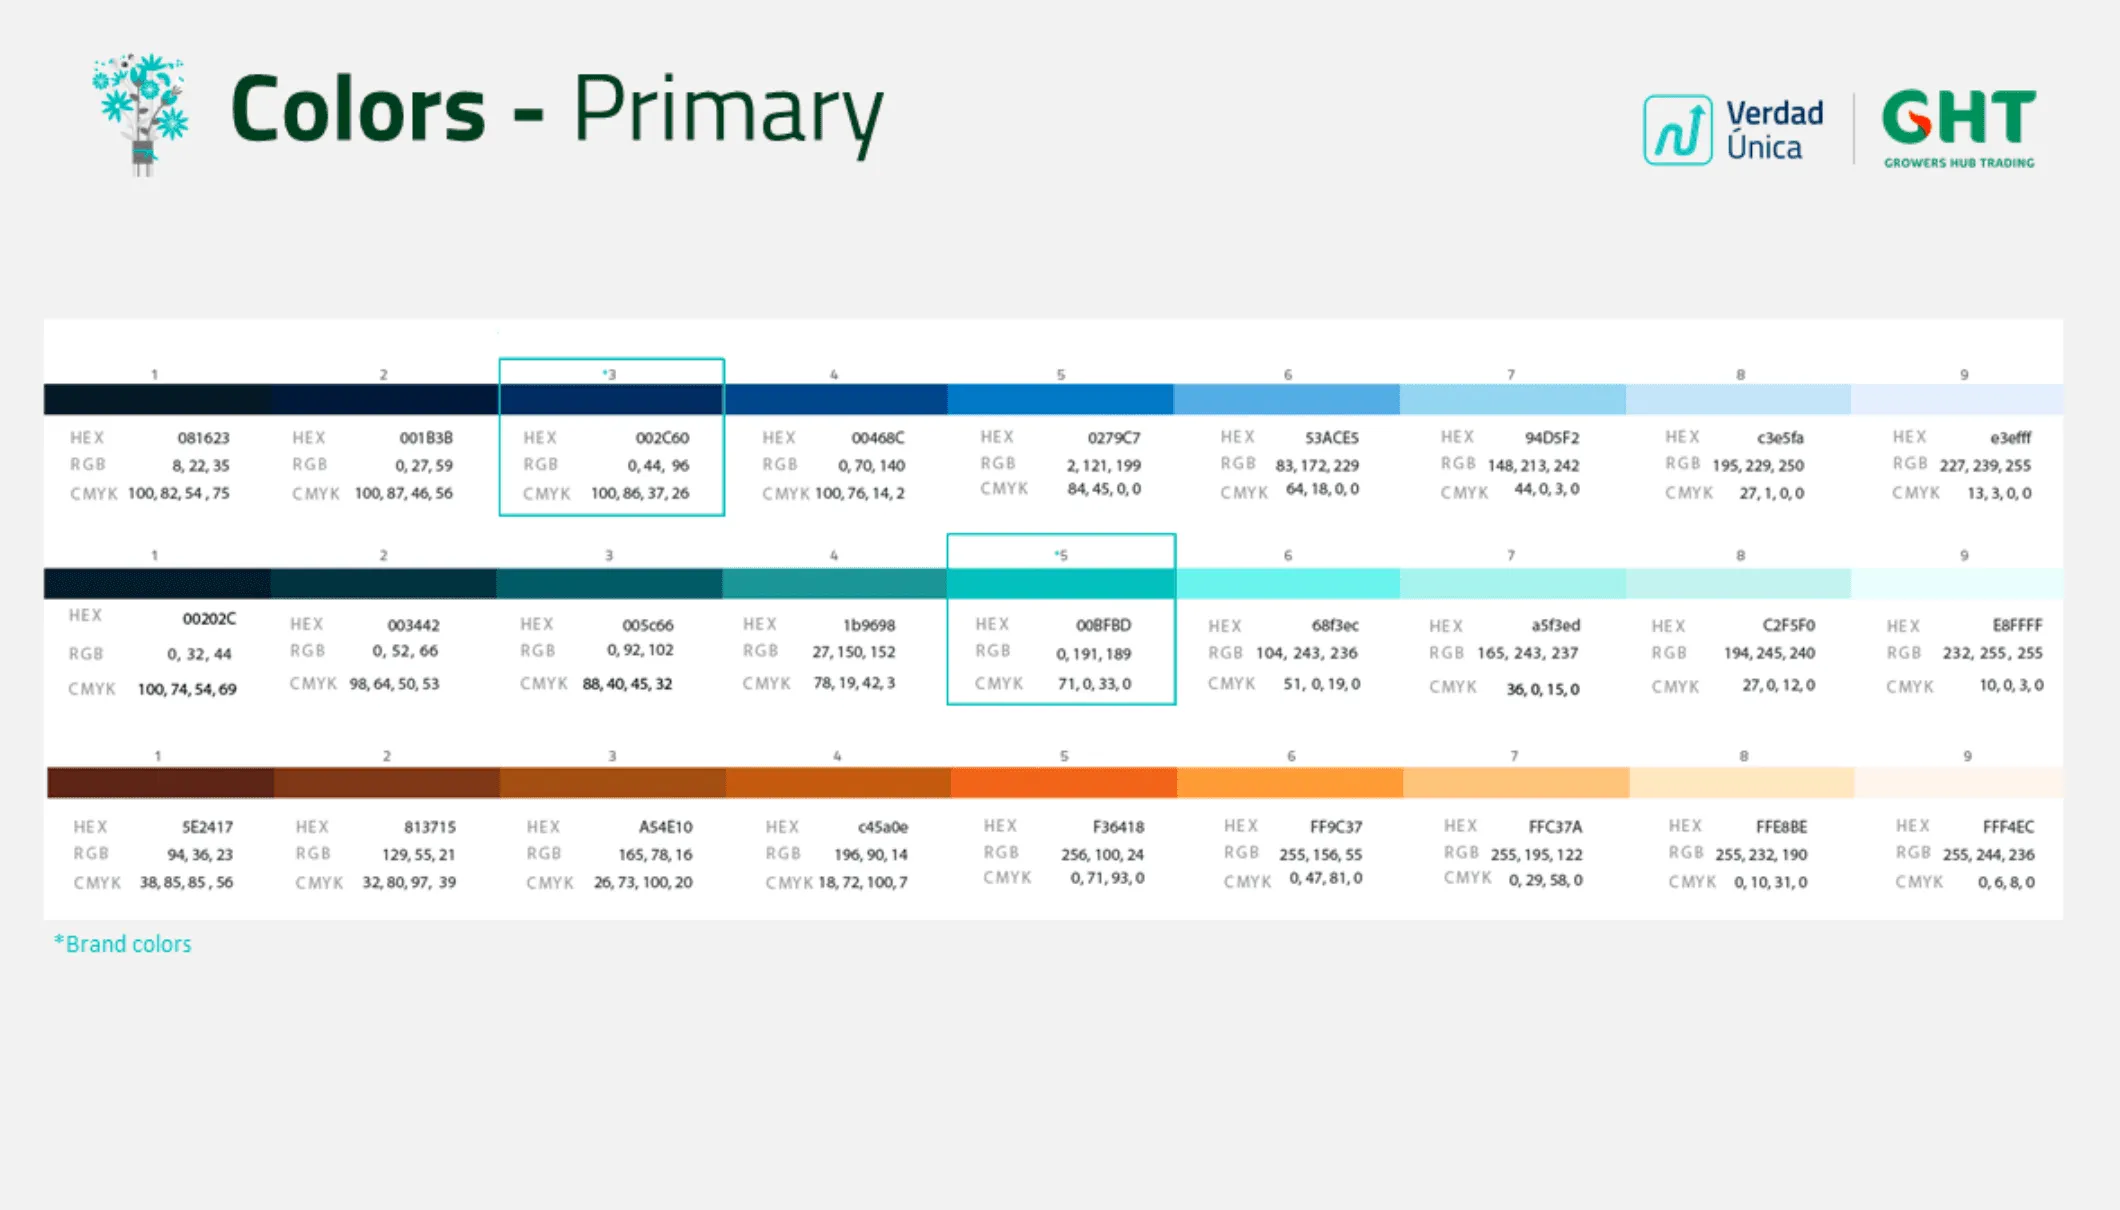
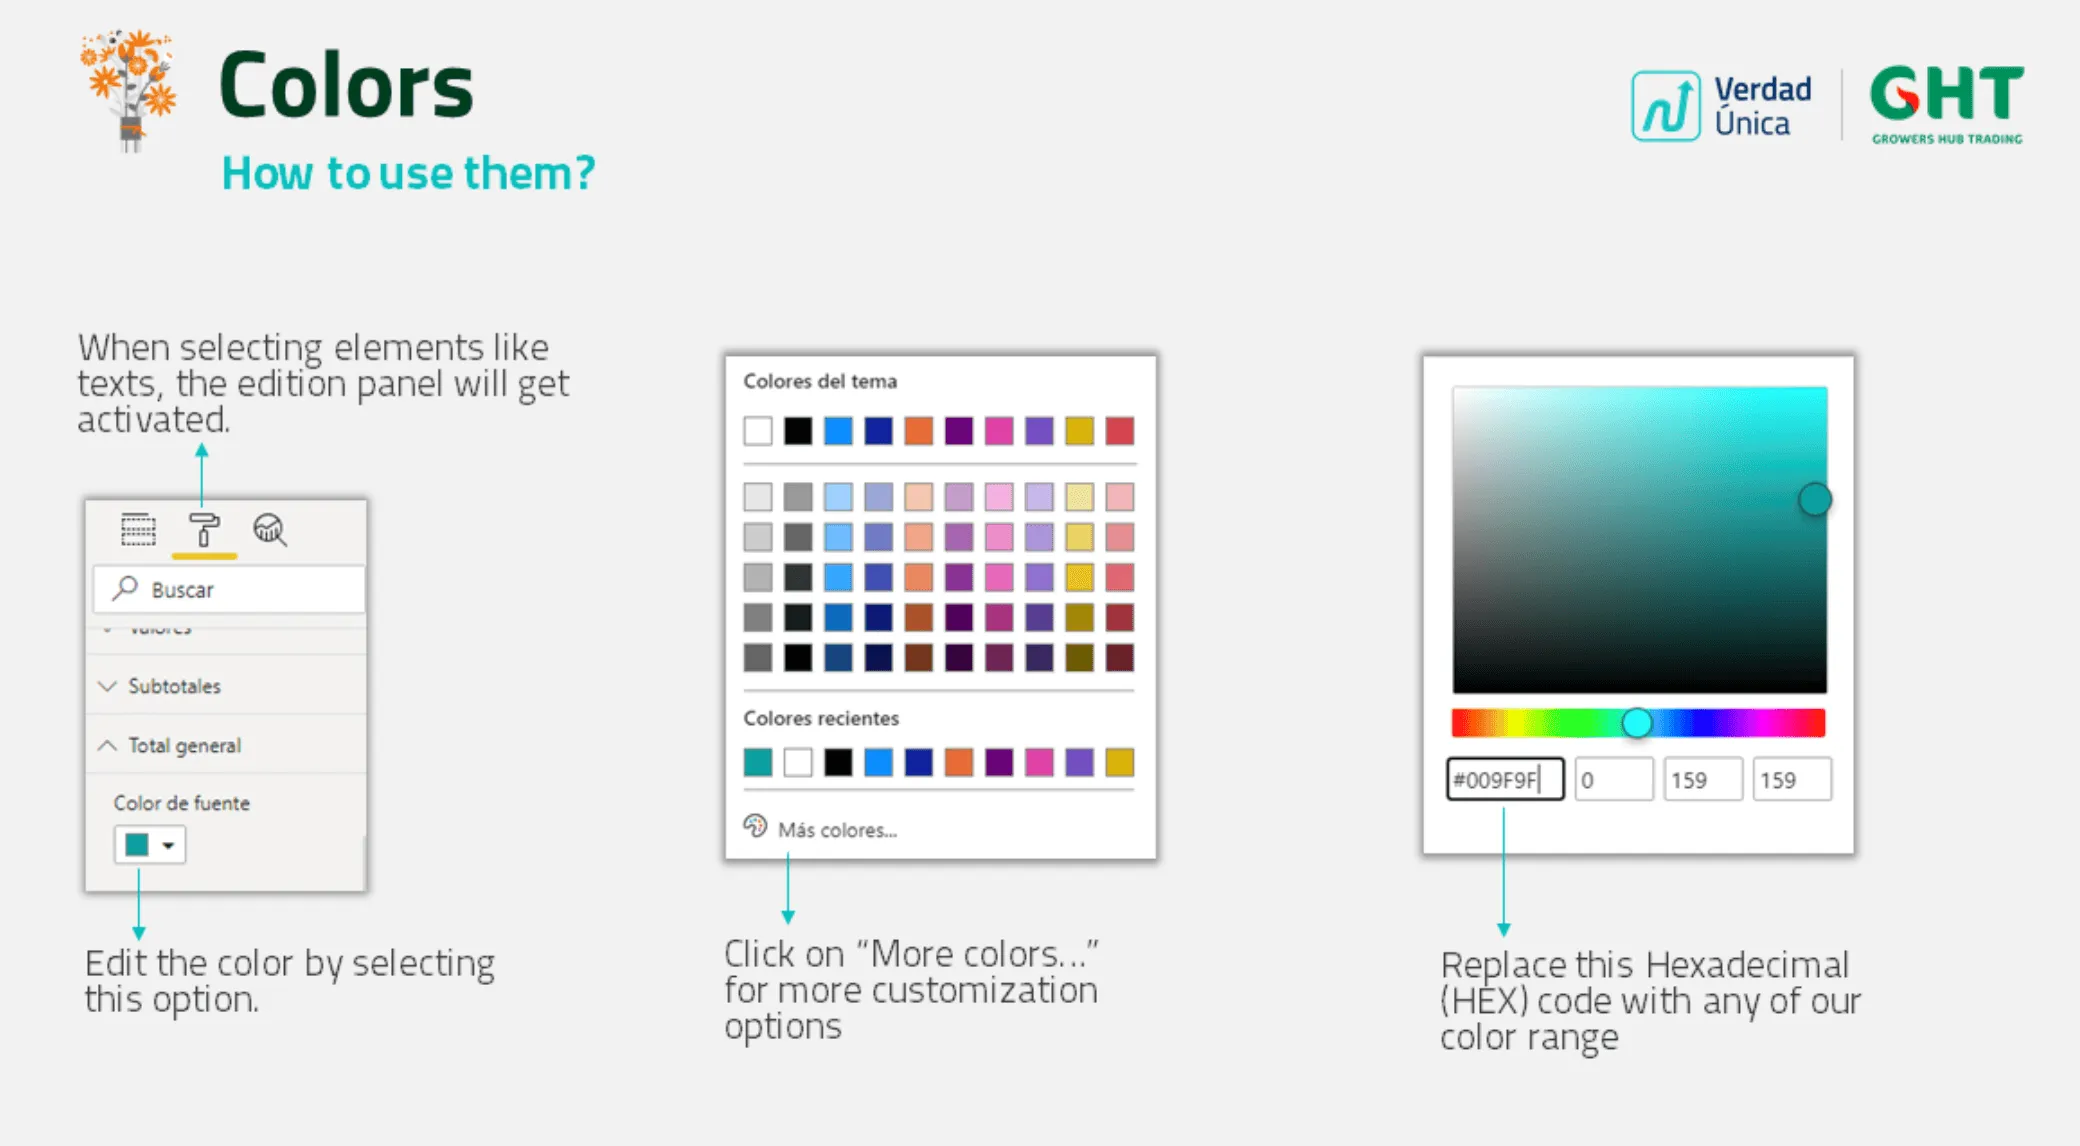
- A color palette with primary blues, turquoise and orange scales, with HEX, RGB and CMYK values.
- Font sizes and colors for each element of a report.
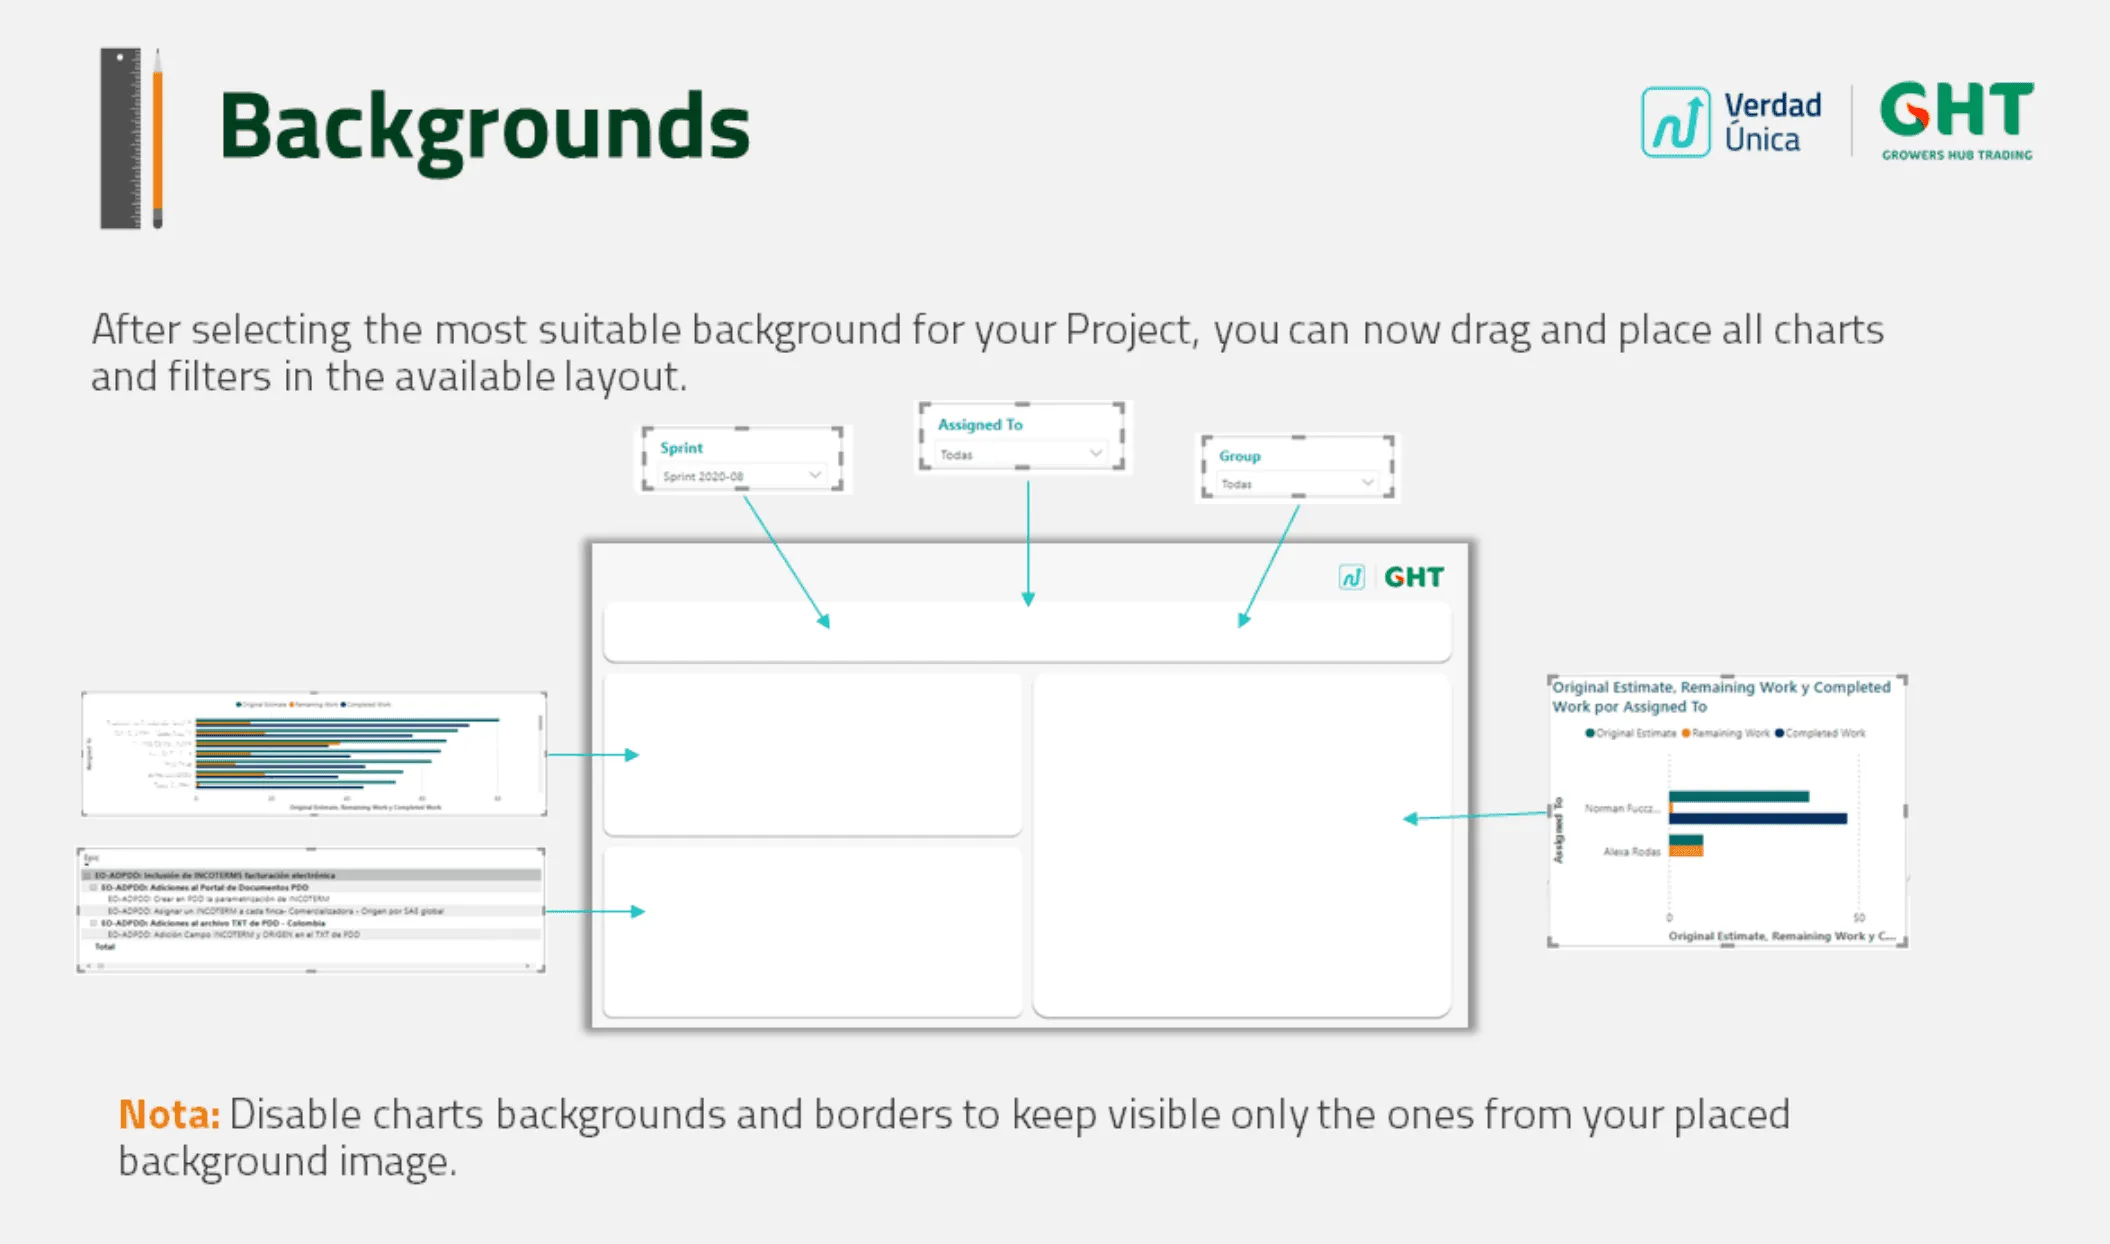
- Background layouts.
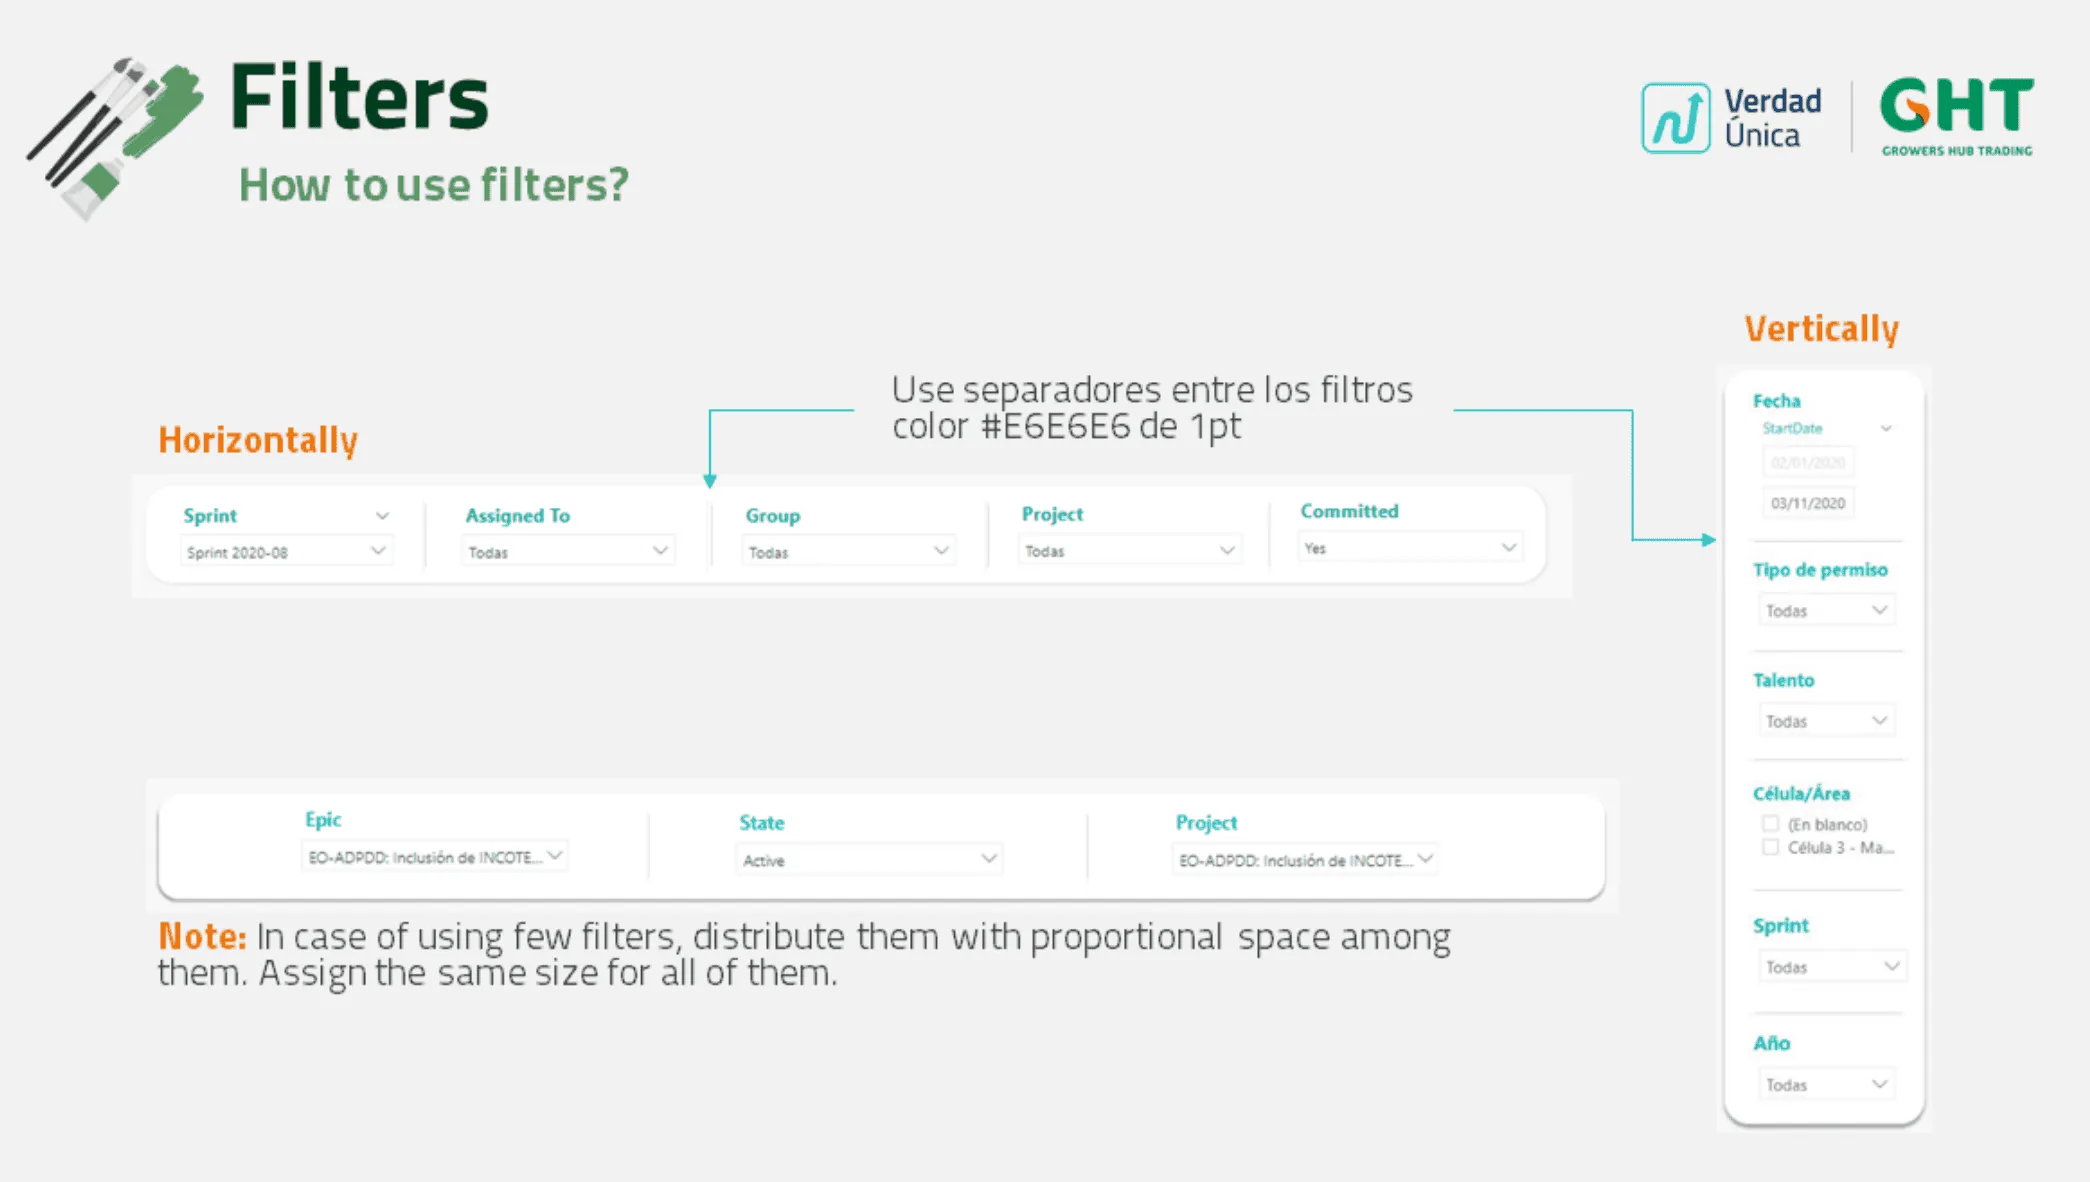
- Filter rules.
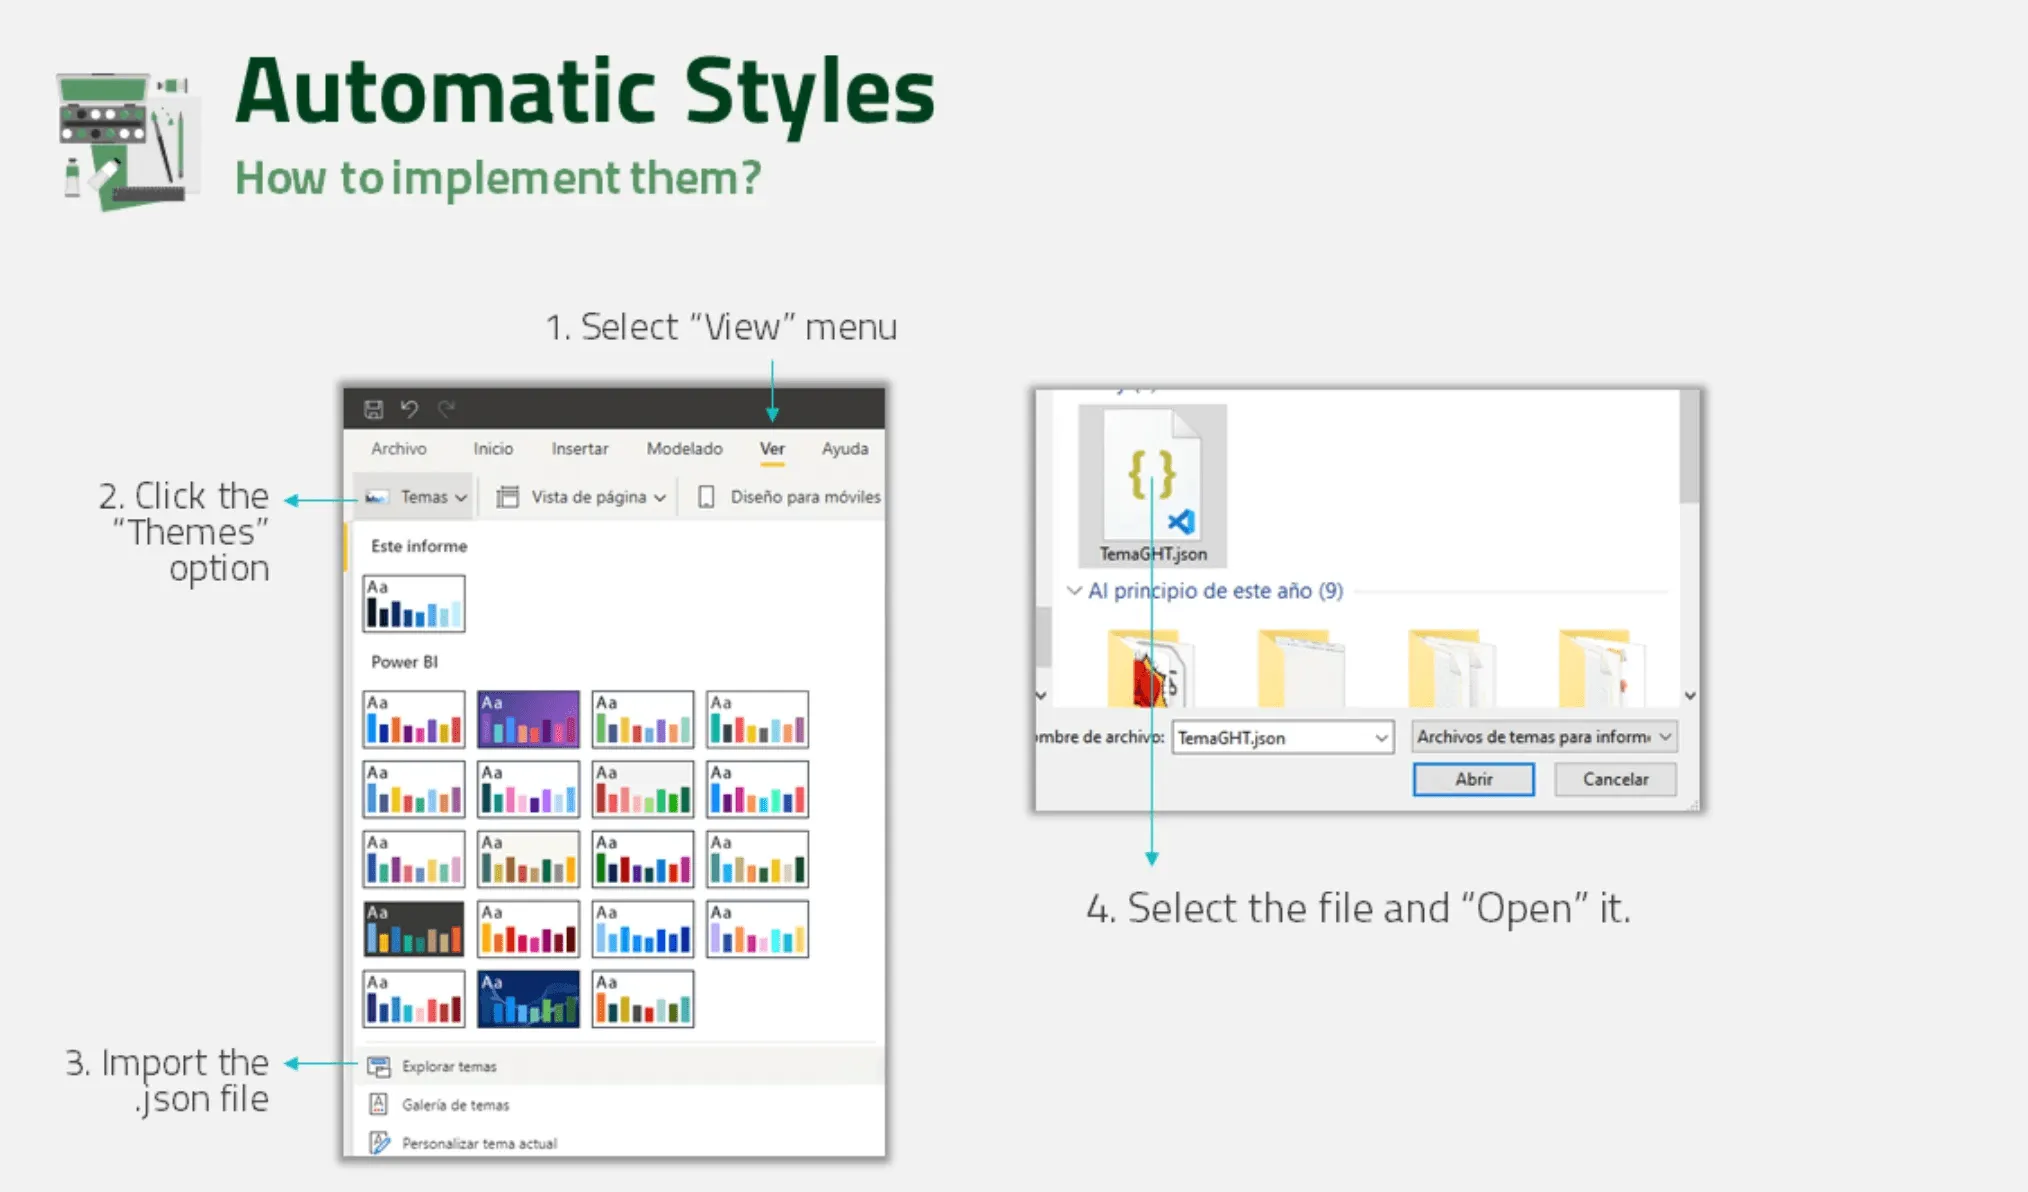
- An automatic Power BI theme.
Research
I ran five pieces of research work:
- A UX introduction for attendees.
- A comparative evaluation of two report proposals.
- A Yes/No diagnostic activity.
- A discussion session with subject-matter experts.
- Research on Power BI’s customization options.
Approach
The project started just before the annual Analytics event. That let me work with attendees from every business area at once.
1. UX introduction
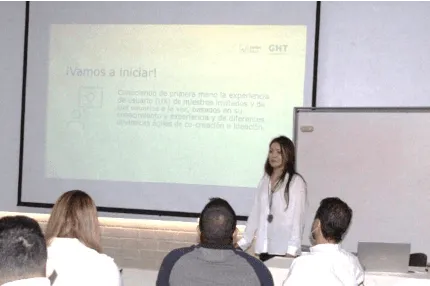
I gave a short talk so attendees understood why users matter in user-centered design.
2. Comparative evaluation
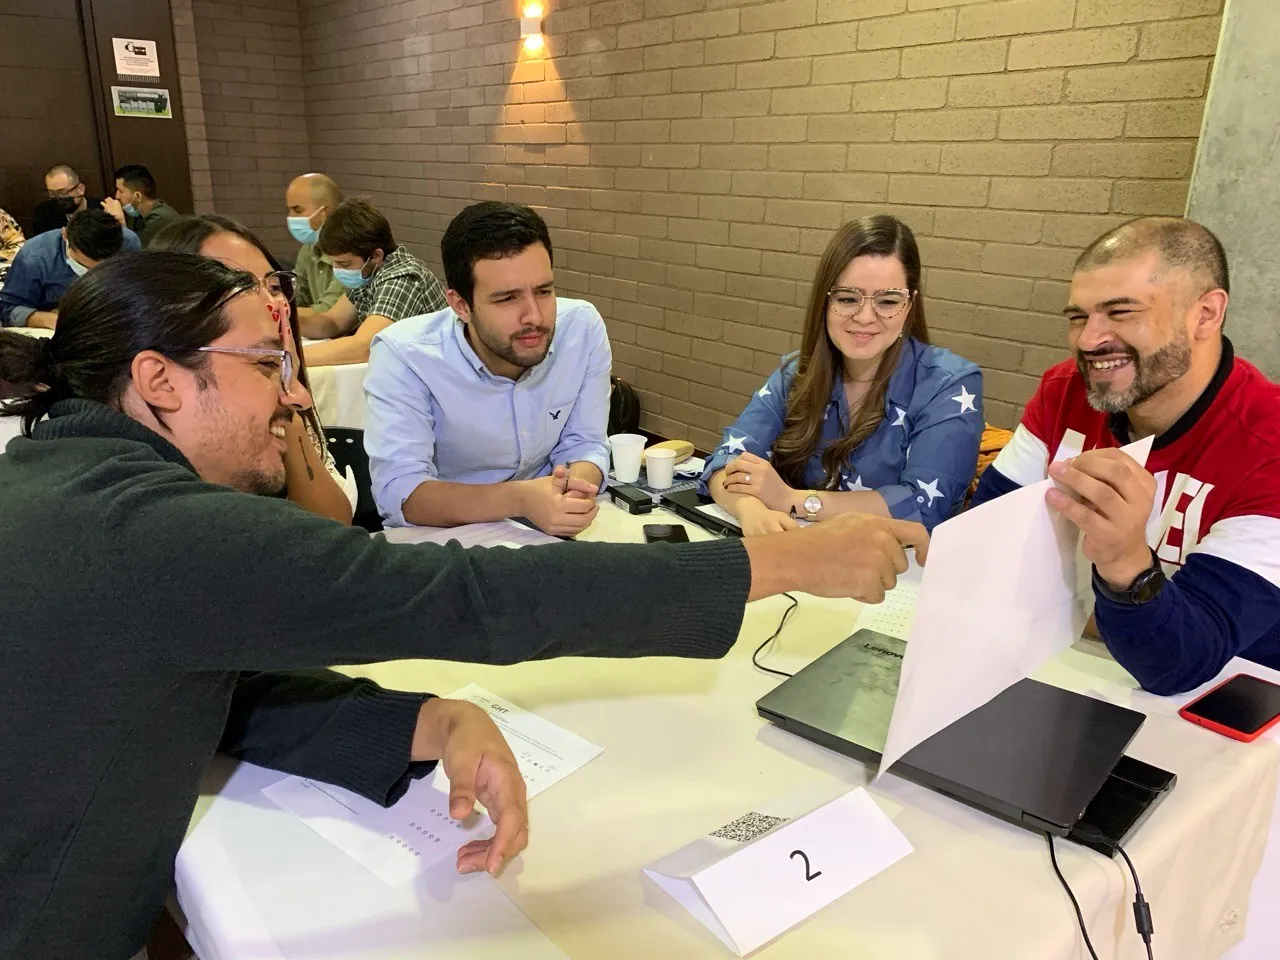
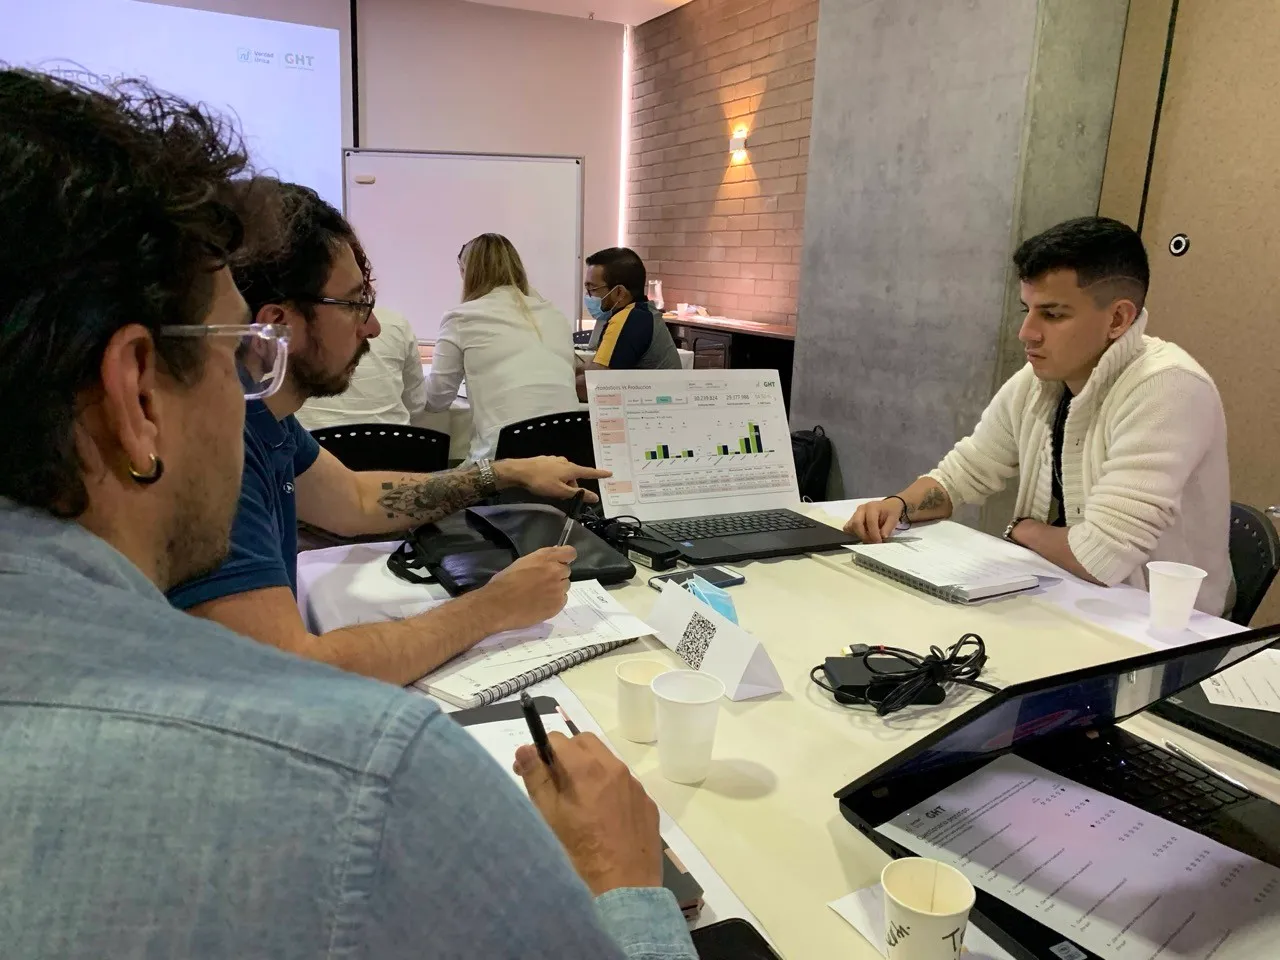
Groups compared two report proposals and said which worked better for them.

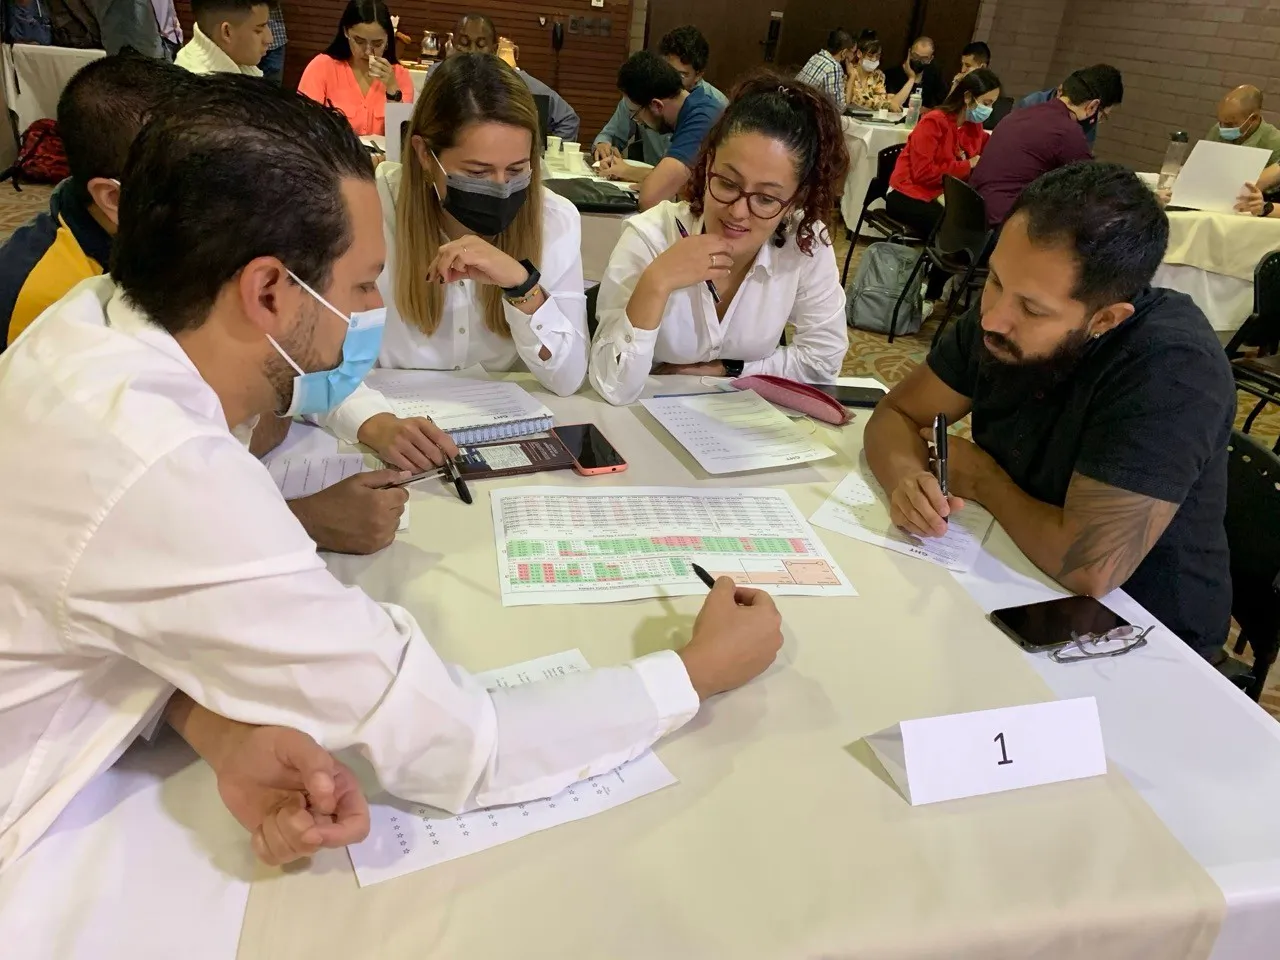
What the groups told us:
- Timeline line charts or bar charts are easier to read than a matrix.
- A matrix works best for large amounts of detailed information.
- High color contrast makes reports easier to read.
- A unified structure and style across reports makes them easier to understand.
- White space helps users read calmly.
3. Yes/No diagnostic
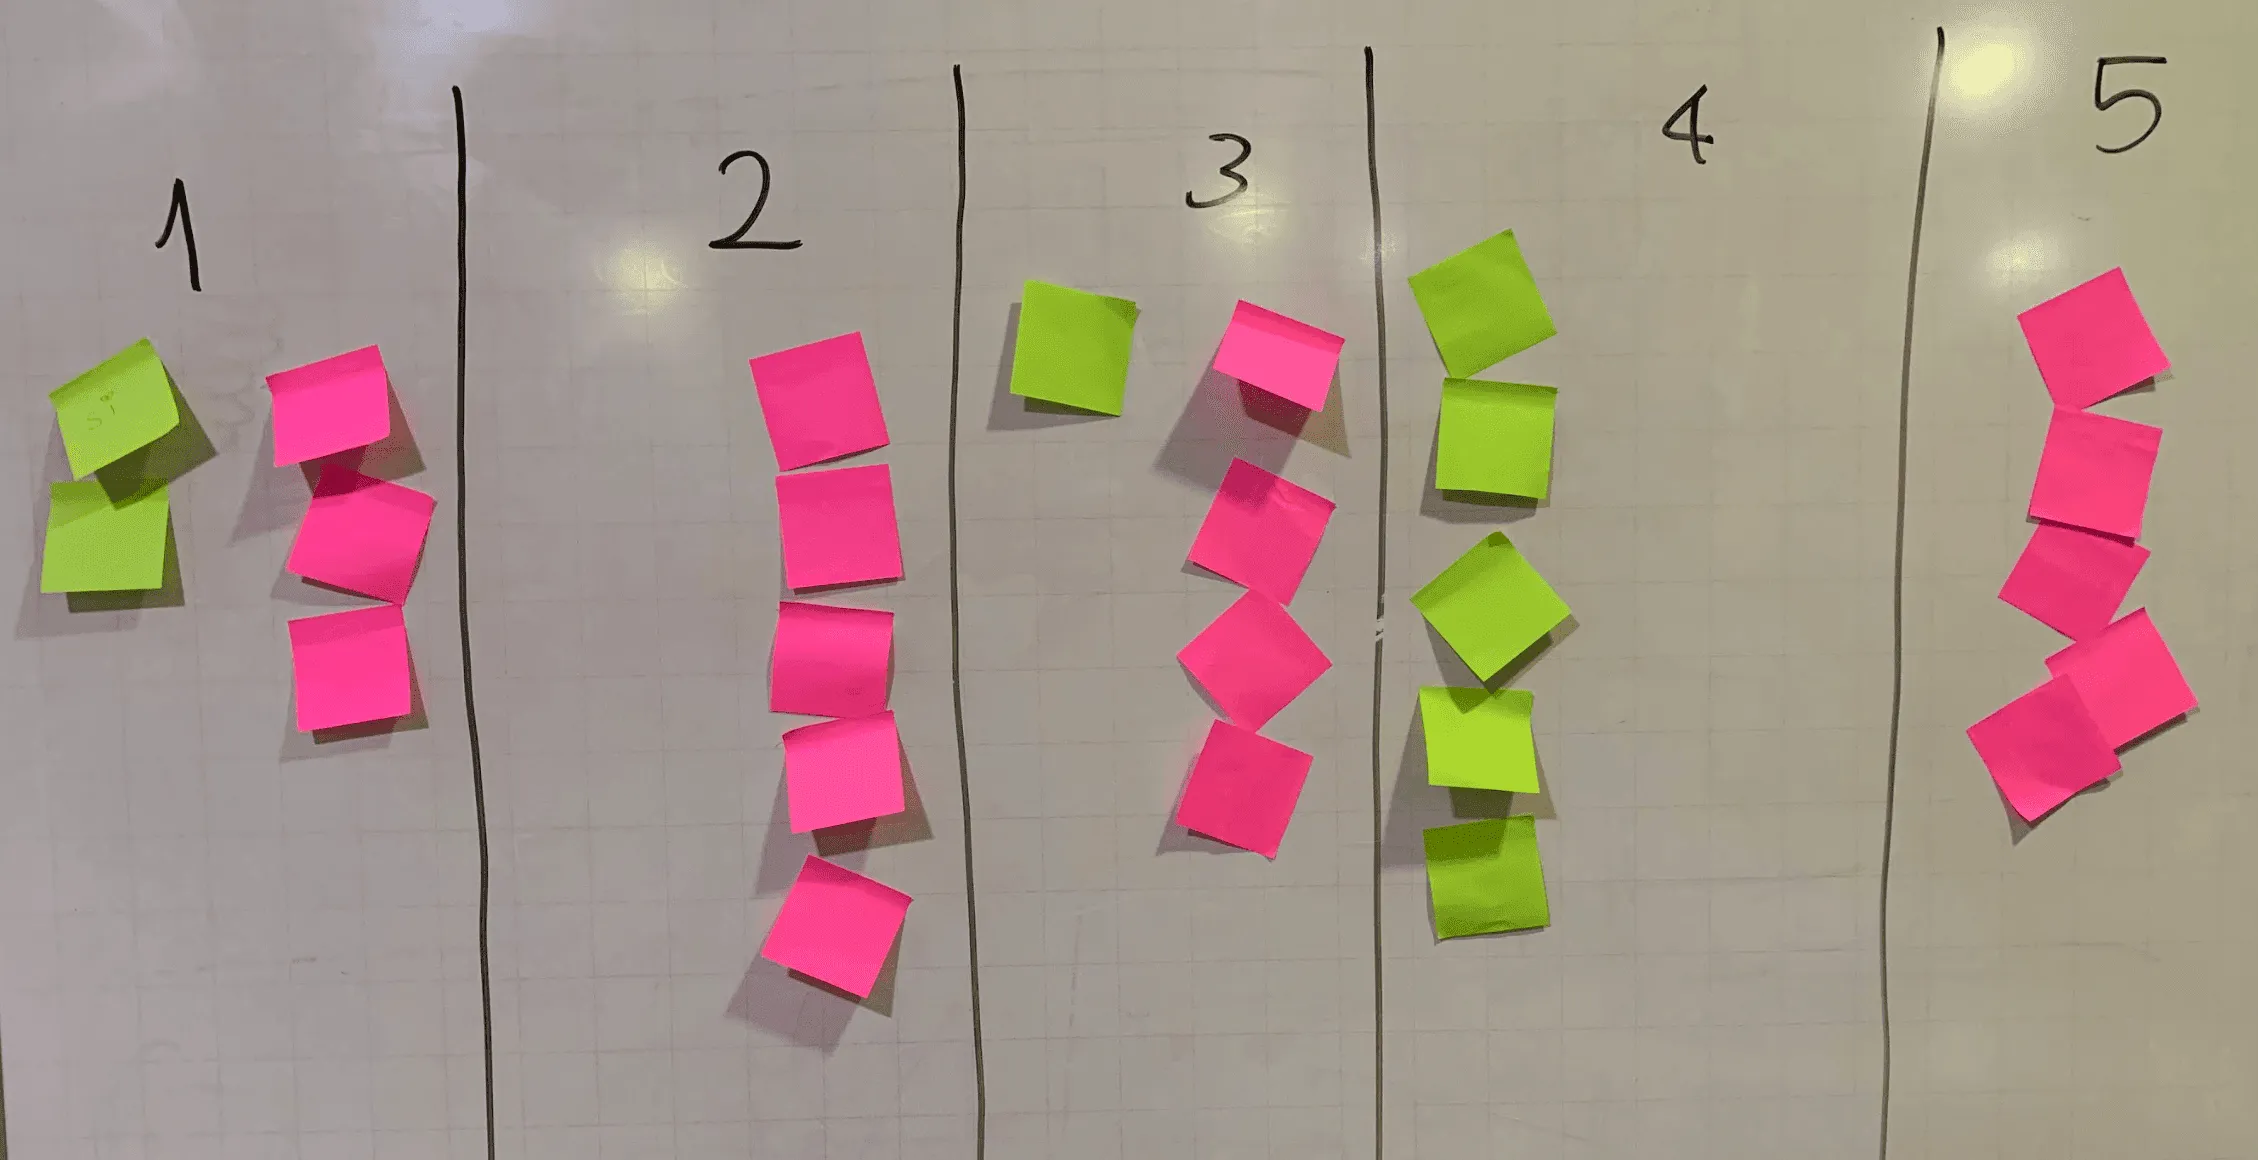
Five groups answered Yes or No to five statements. I used it as a quick read of perception, not as statistical evidence.
| Statement | Yes | No |
|---|---|---|
| Current reports with different styles and structures are visually appealing. | 2 | 3 |
| Users easily understand any report because they know the topics. | 0 | 5 |
| Reading current reports is easy because their structure is consistent. | 1 | 4 |
| A style guide helps create reports faster. | 5 | 0 |
| Making decisions with the current reports is easy. | 0 | 5 |
4. Discussion with subject-matter experts
I facilitated a session where experts explained how they use and interpret reports.
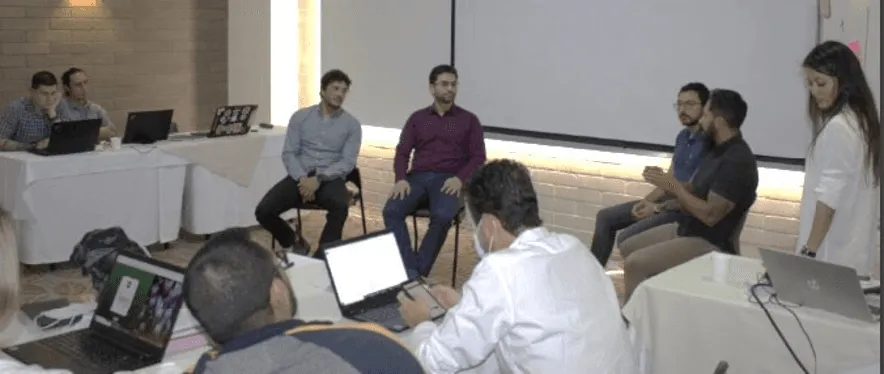
They said:
- Too many styles and structures slow interpretation.
- Chart variety did not help, and chart types were sometimes wrong for the data.
- Contrast, a unified structure and white space help.
5. System definition
I researched what Power BI allows to customize, then built the design system.
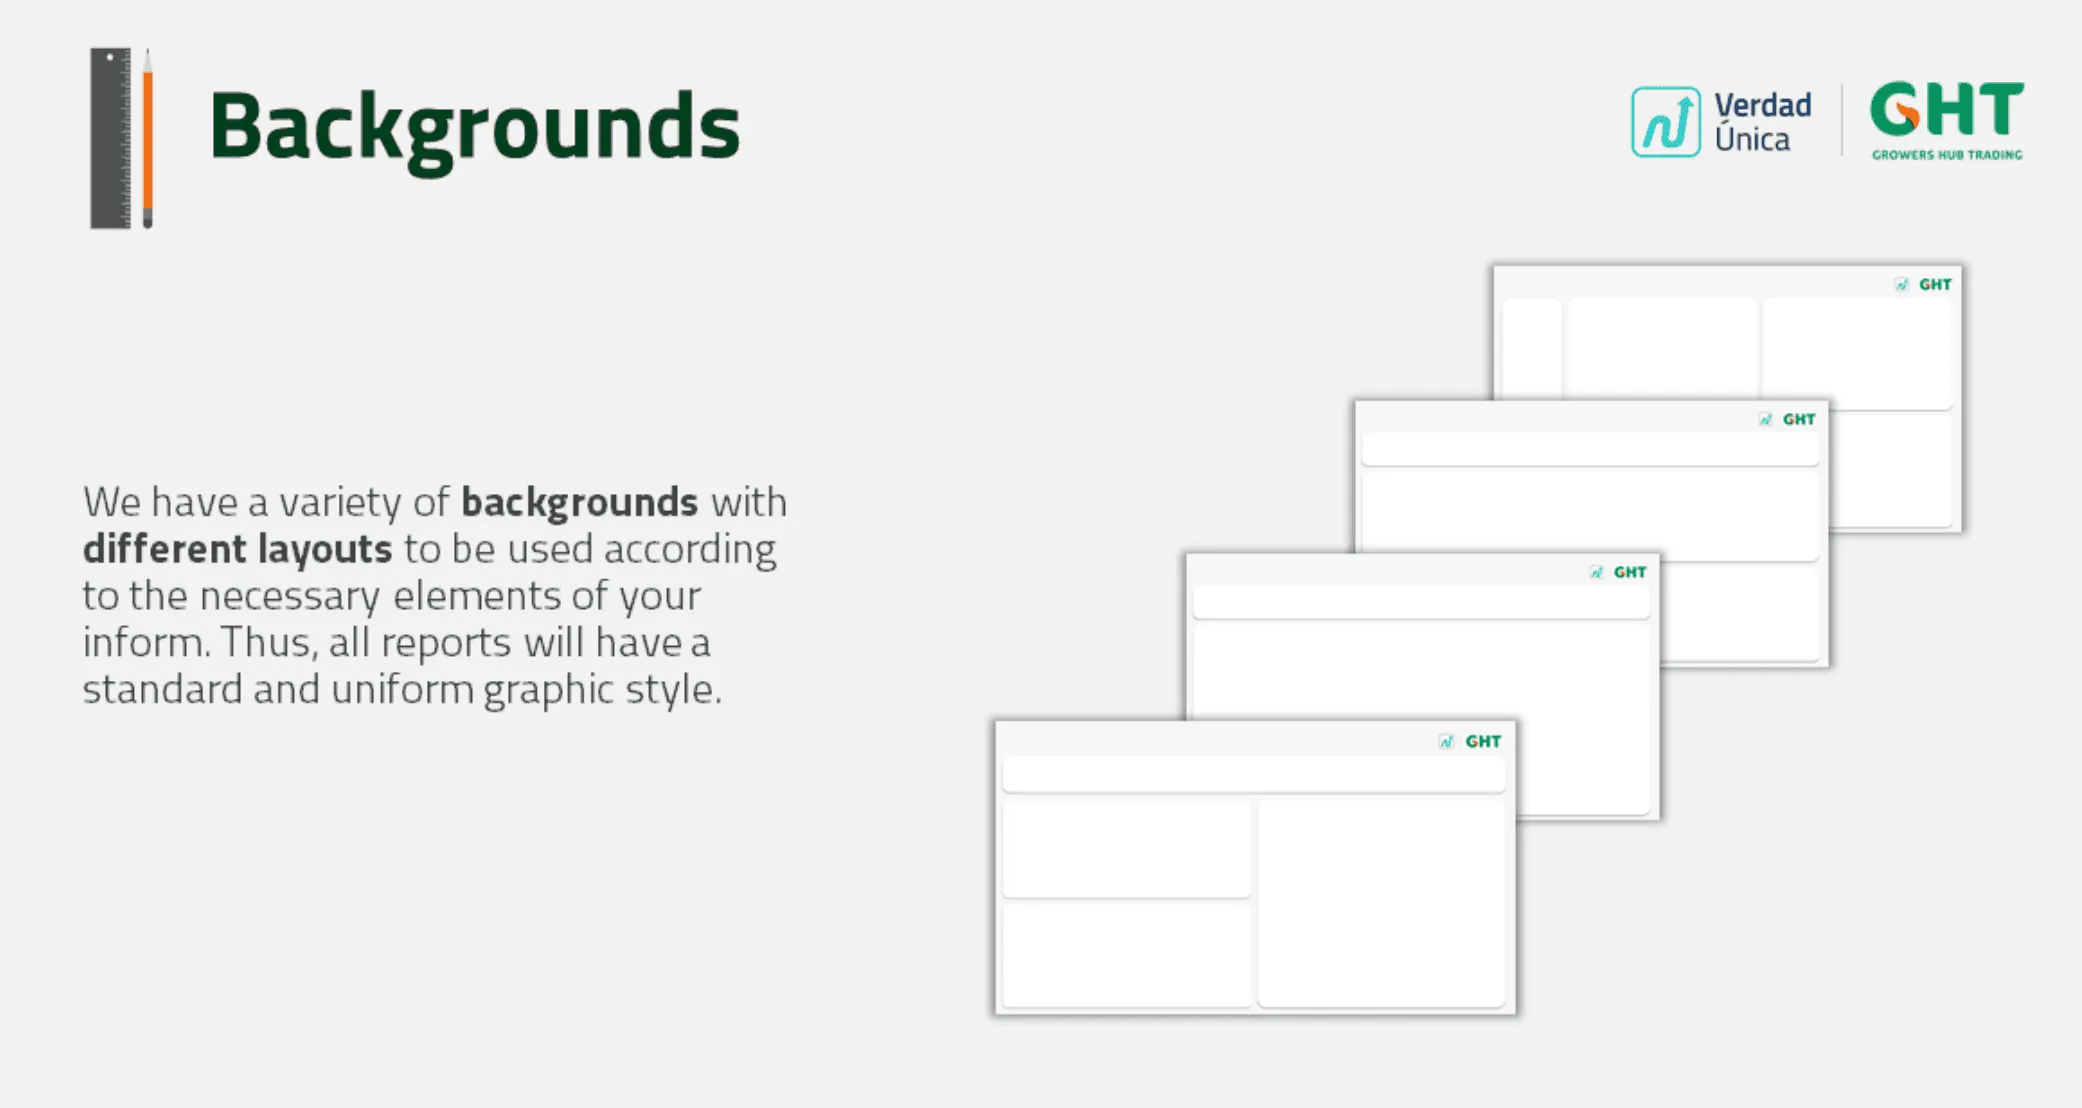
Tools and how they were used
- Power BI: I researched its customization limits. The system explains how to apply colors in the editing panel, import the automatic theme (
TemaGHT.json) and place charts and filters on the background layouts. - Figma: system pages and background layouts.
- Illustrator: background templates and graphic pieces.
- FigJam and Miro: synthesis of the findings from the event activities.
Key decisions
-
Build the rules with the analysts, not hand them a guide.
- I chose to agree the rules with report creators in open debate during the event, over designing the guide alone and publishing it.
- I chose this because adoption depended on 60+ invited analysts who already had their own habits.
- The cost was time to reach consensus, and giving way on the number of filters. Analysts said they needed multiple filters to use the report data, so I designed templates with a layout that broke the initially planned scheme a little.
-
Ship the system as a Power BI theme and templates, not only a document.
- I chose an automatic theme (
TemaGHT.json) plus background layout templates, over a PDF style guide that analysts apply by hand. - I chose this because Power BI limits customization, and a theme applies the rules in one click.
- The cost was that the templates constrain layouts. Unusual reports must fit into the available backgrounds.
- I chose an automatic theme (
Edge cases and states
- Reports with large amounts of detail (matrix) versus trend reports (line or bar charts).
- Horizontal versus vertical filter areas, with separators and equal sizing rules.
- Charts placed on backgrounds with chart backgrounds and borders disabled, so every report shares one frame.
Challenges
- Agreeing on data visualization practices for each business context.
- Power BI’s customization limits. I solved this with the automatic theme and background templates.
- Users from many areas (logistics, operations, commercial, financial) with different needs. The Analytics event brought them all together.
- Getting report creators to adopt the system. I built the rules with them through conversation and debate.
Result and impact
- 60+ business analysts invited to build and use the system. Source: the attendance list of the Analytics event. This counts invitations, not adoption.
- 20% less time to build a report, on average. This is the average time saved building a report. I measured it with surveys and validated it against the volume of reports that arrived after the guide and theme were delivered.
- 250+ users read operational, tactical and management reports in the new format. Source: the Digital Operations area.
- Creators no longer spent time adjusting styles or trying chart types. Readers got a simpler layout with a defined filter area and clean single or multi-chart structures.
How my experience made the difference
- I used the Analytics event to research with every business area at once, and turned the findings into a system that applies directly in Power BI.
- I opened a space for debate so the analysts owned the rules.
What I learned
Some analysts said the backgrounds did not cover certain report scenarios. I designed generic backgrounds that keep the visual line, to be used as an exception in those edge cases.
Tools
- Power BI
- Figma
- Illustrator
- FigJam
- Miro